Carbon mapping
- GHGSat25 m17 satellitesGHGSat
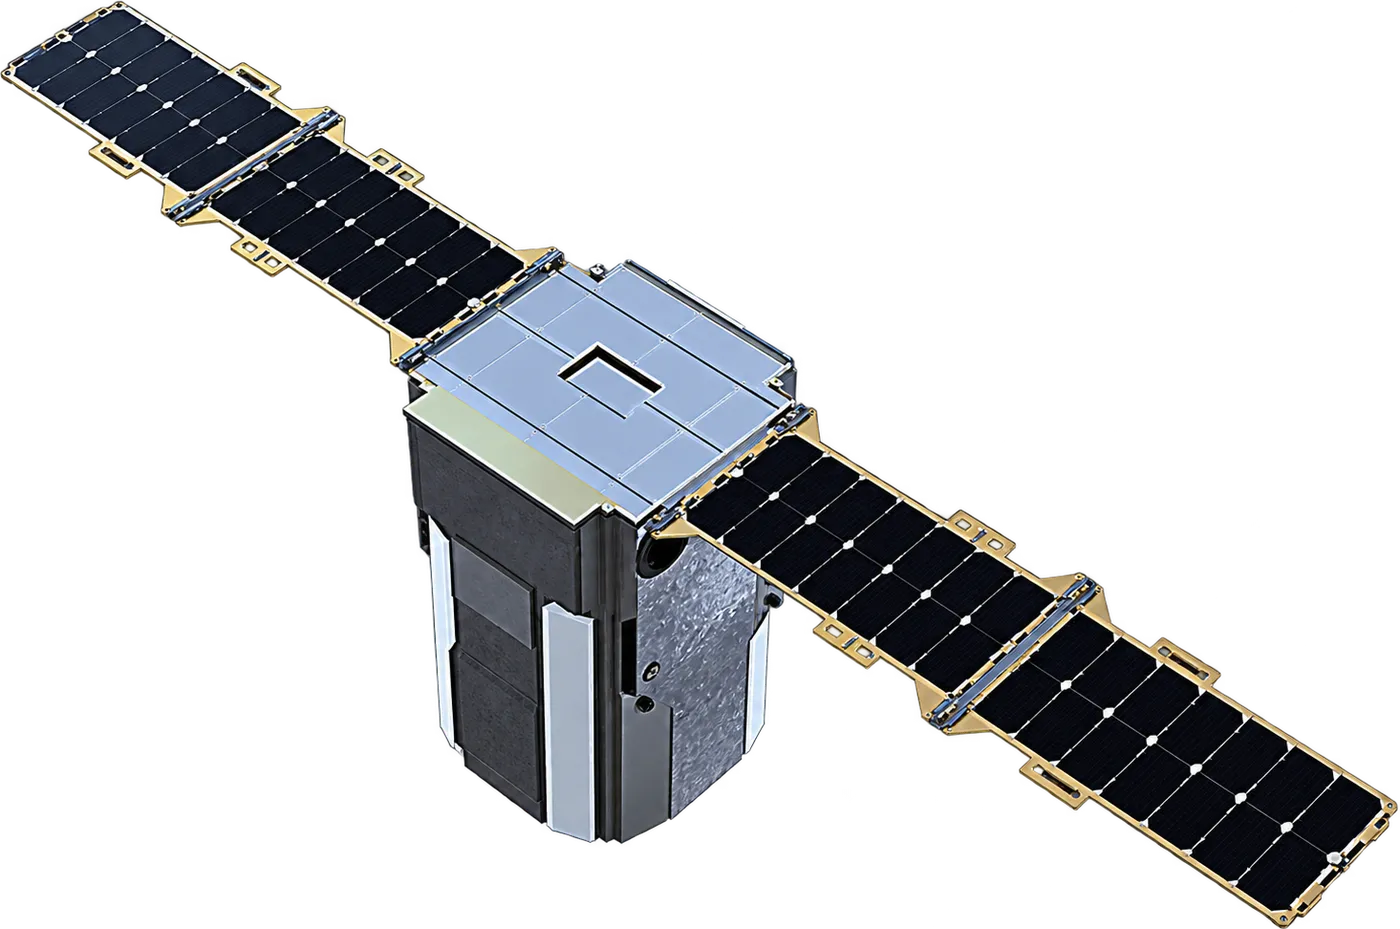
- Tanager30 mPlanet
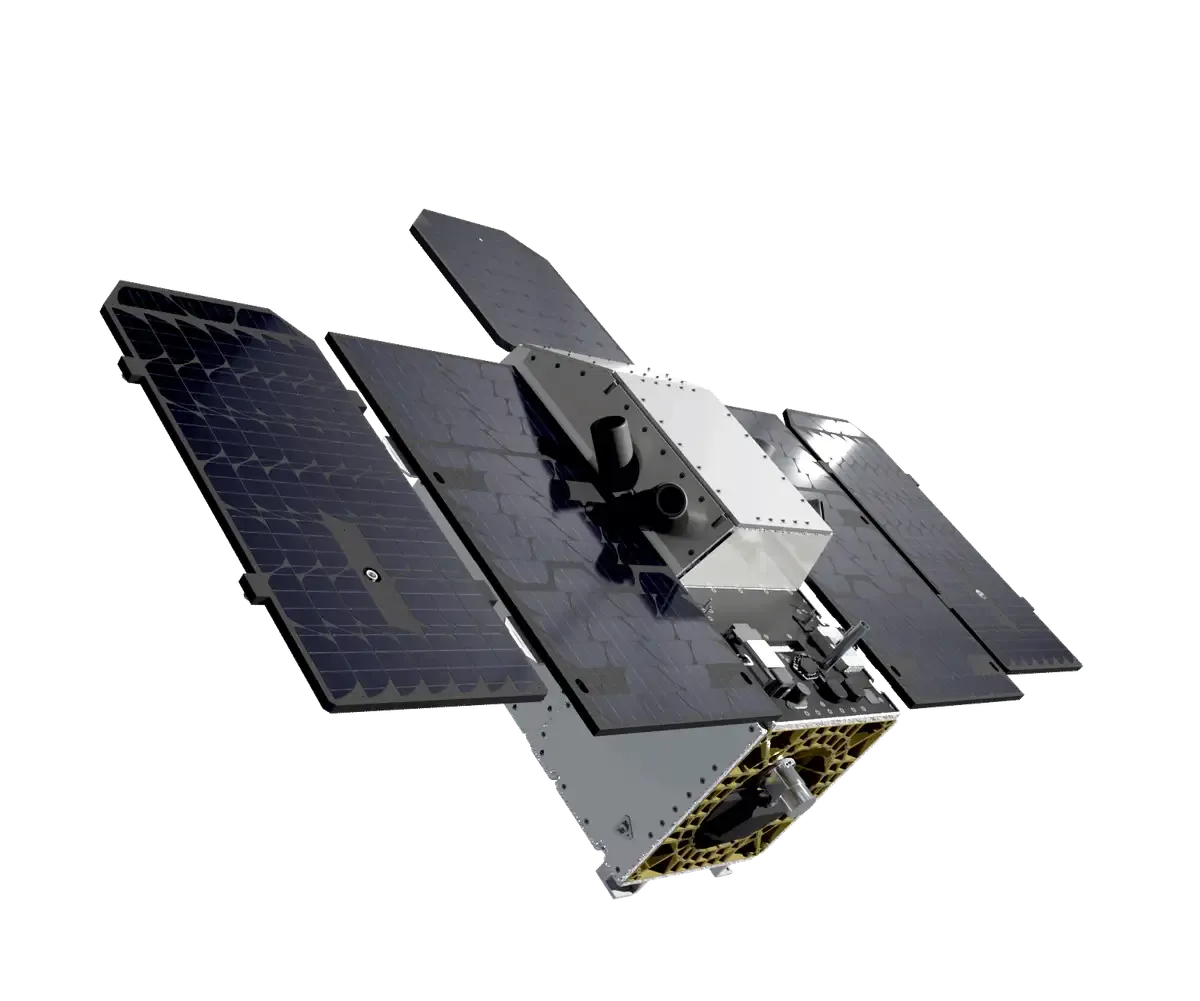
Specifications
- Pixel
- 30 m
- Methane detection
- 64–126 kg/h
- CO2 detection
- 10–19 t/h
- Spectrometer
- 380–2500 nm
- Coverage
- 18 km swath
- Orbit
- ~430 km, sun-synchronous
Detection
A source’s emission rate against the published detection limits, with its yearly total and CO₂ equivalent.
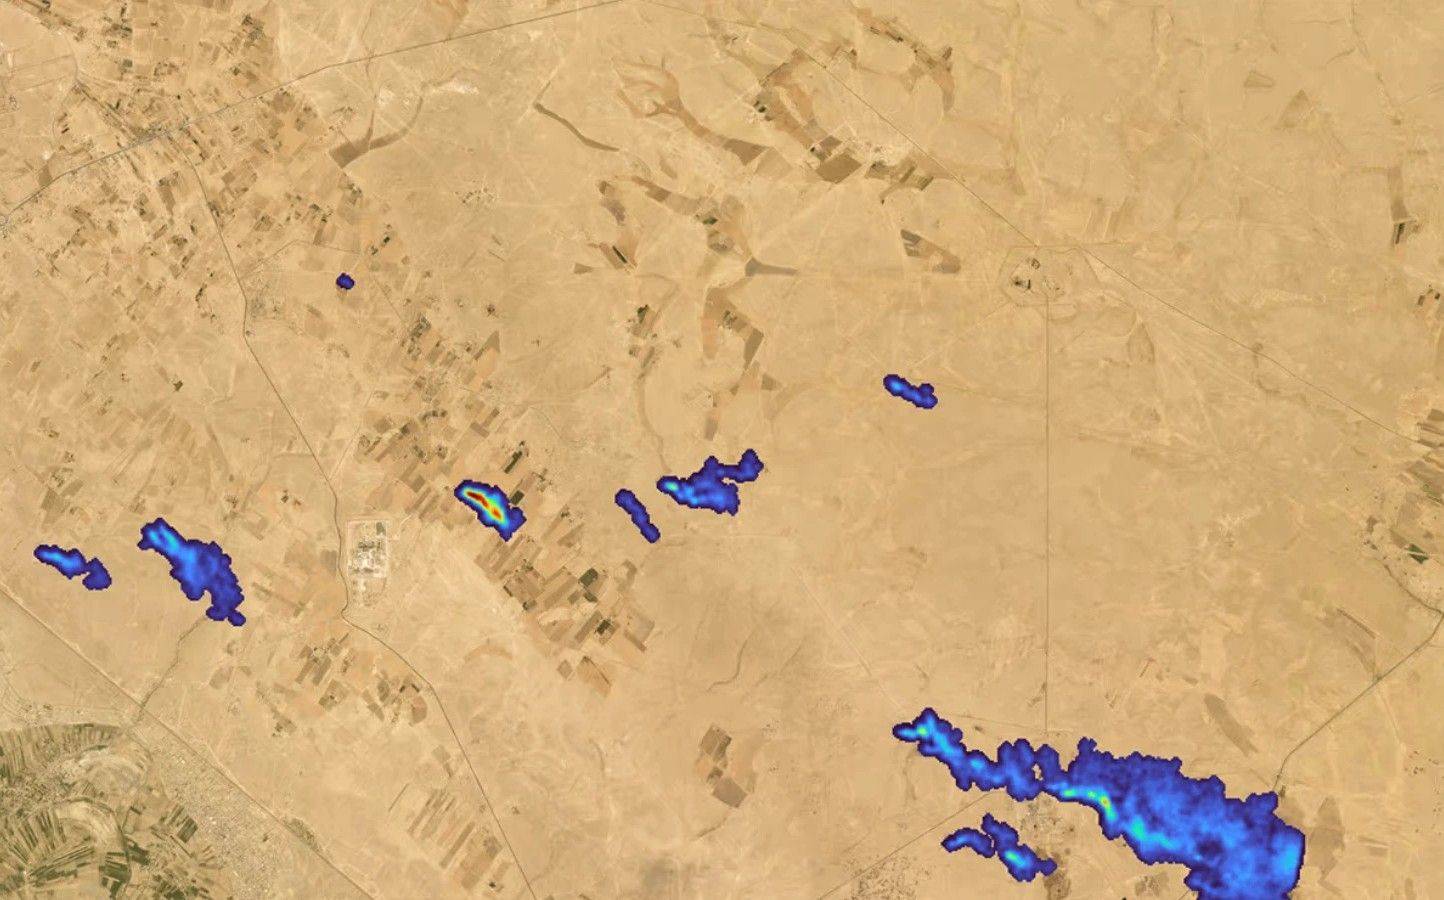
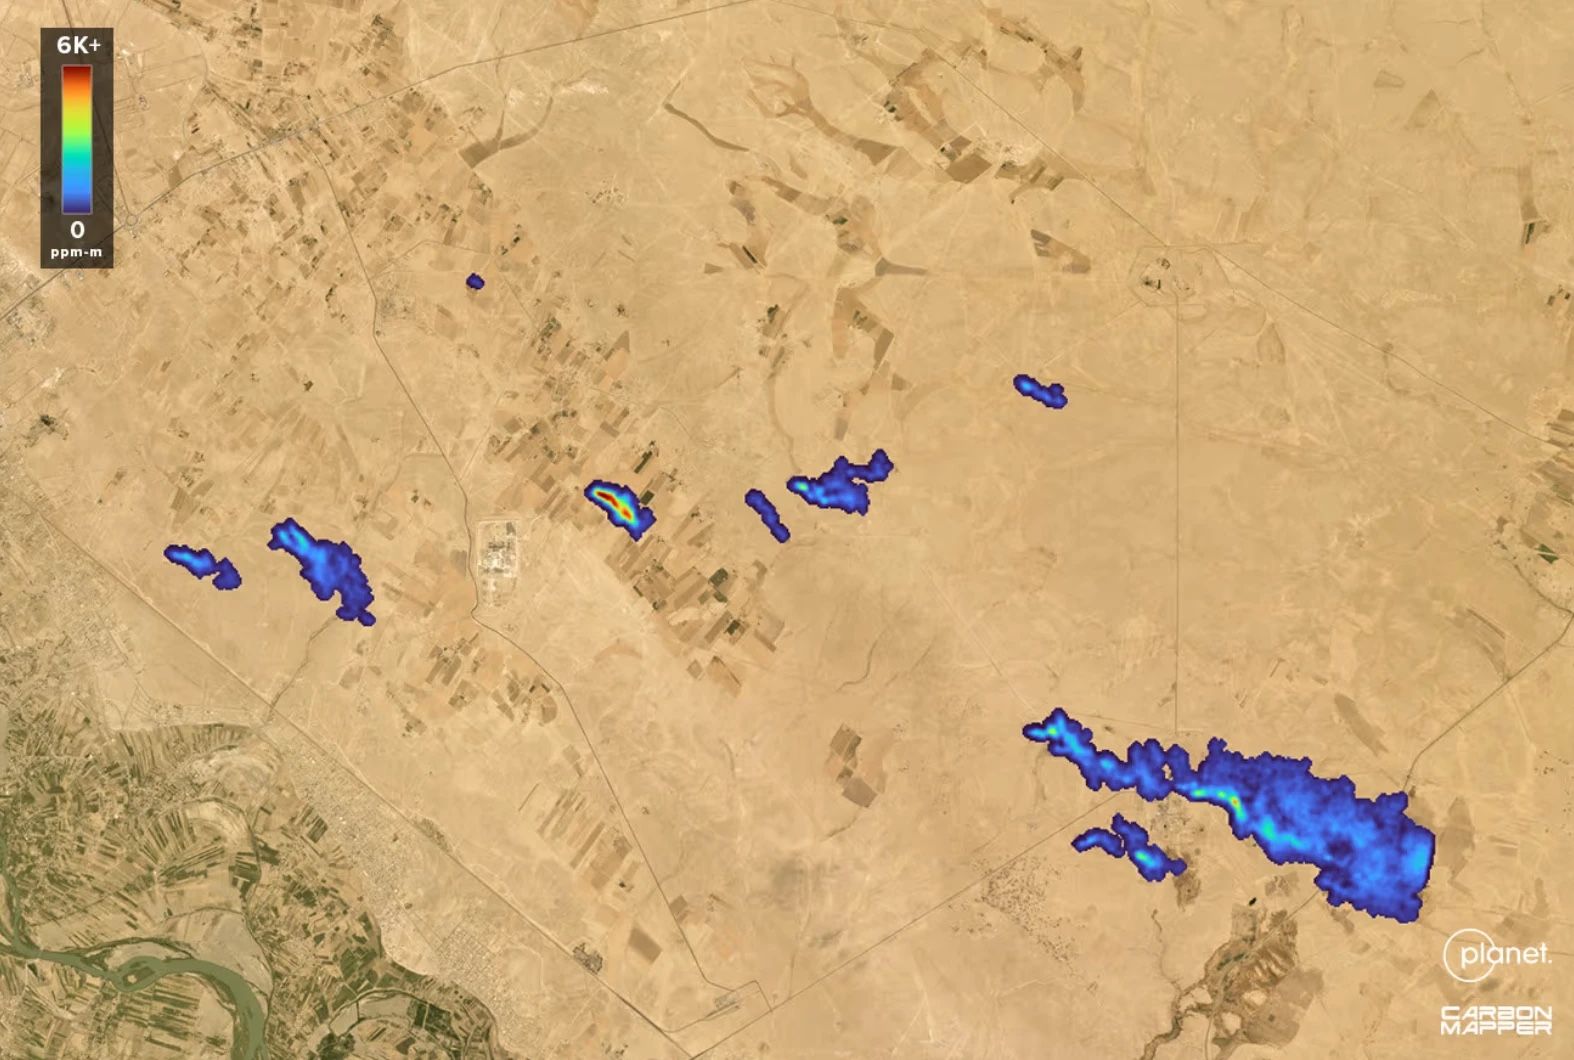
Tanager-1 first plumes, 2024
- Emission rate
- Per year
- CO2e, 100-year
- CO2e, 20-year
Published limits under each source’s own conditions. CO2e: IPCC AR6, fossil methane.
Bands
Methane absorbs at 1.65 and 2.3 µm, CO₂ at 1.61 and 2.06 µm. Tanager reads all four at ~5 nm.
2250–2350 nm
- Spectral sampling
- ~5 nm
- Channels
- ~426
- Range
- 380–2500 nm
- Bands read
- CH4 1.65 and 2.3 µm · CO2 1.61 and 2.06 µm
Pixel
The same plume at 30 m and 5.5 × 7 km. A large pixel averages it into the background.
52000 ppb
- Peak pixel, ΔXCH4
- Plume above 100 ppb
Model: steady Gaussian plume, neutral stability, 3 × 2 km frame. Enhancement above background.
Gallery
Select a frame to open it at full resolution.
Detects
- Methane from oil and gas sites, coal mines, landfills and industry
- The emitting facility, not only the region around it
- Emission rate in kg/h, from the plume and the wind
- CO2 from power stations and heavy industry