Hyperspectral
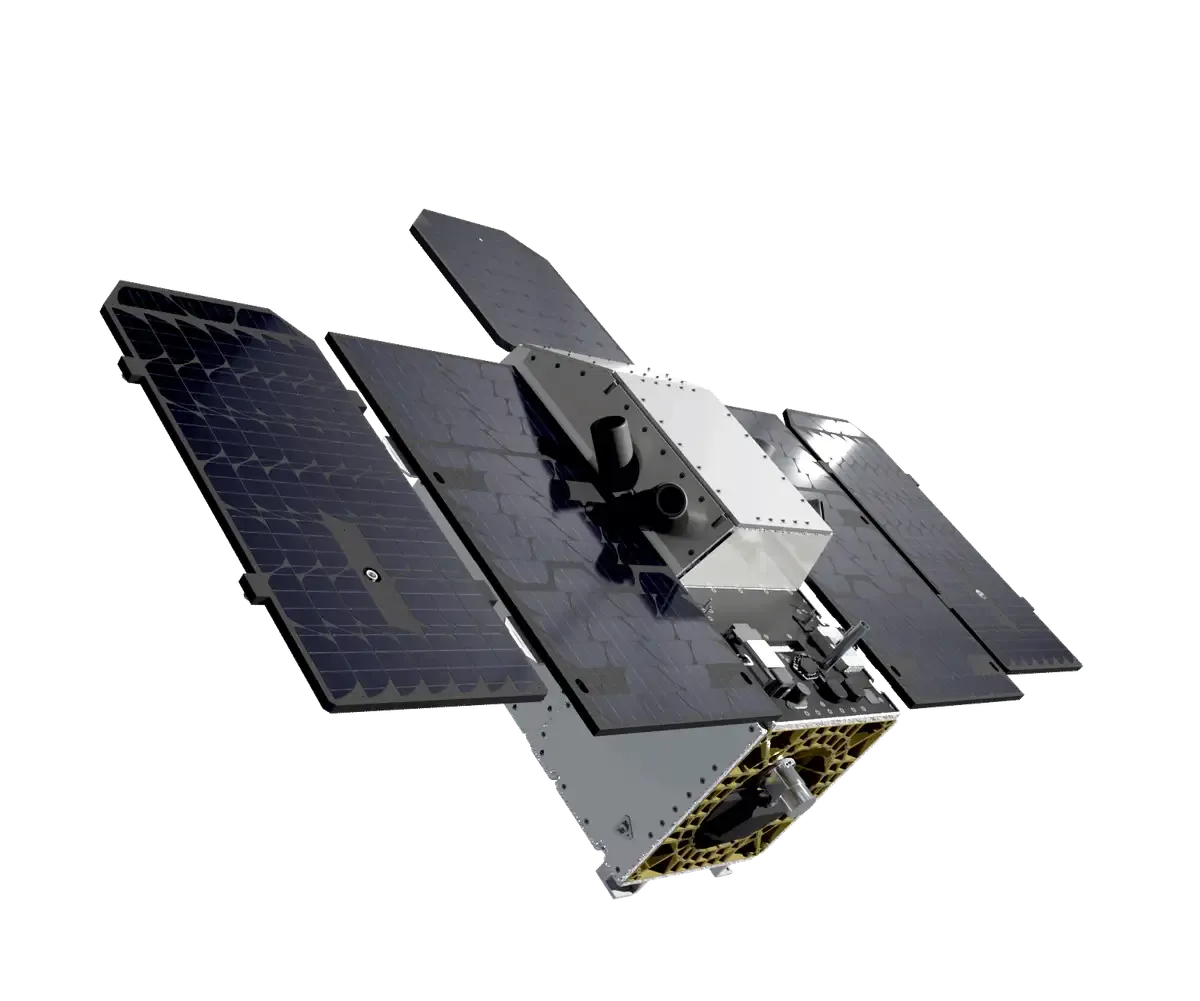
- Fireflies5 m6 satellitesPixxel
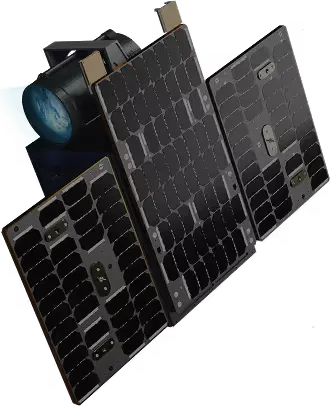
- Dragonette5.3 m5 satellitesWyvern
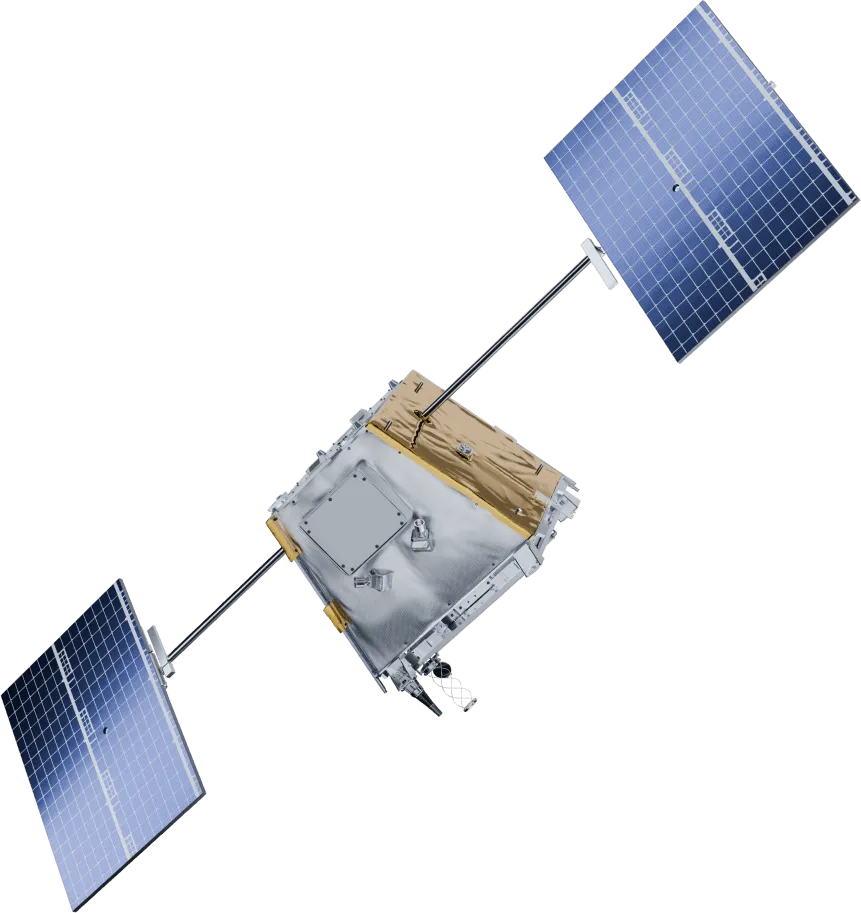
- Tanager30 mPlanet
Specifications
- Bands
- Up to 400+
- Spectral range
- 400–2500 nm
- Resolution
- 5 m to 30 m
- Swath
- 18 km to 40 km
- Deliverable
- Classified map or index layer; full cube on request
Bands
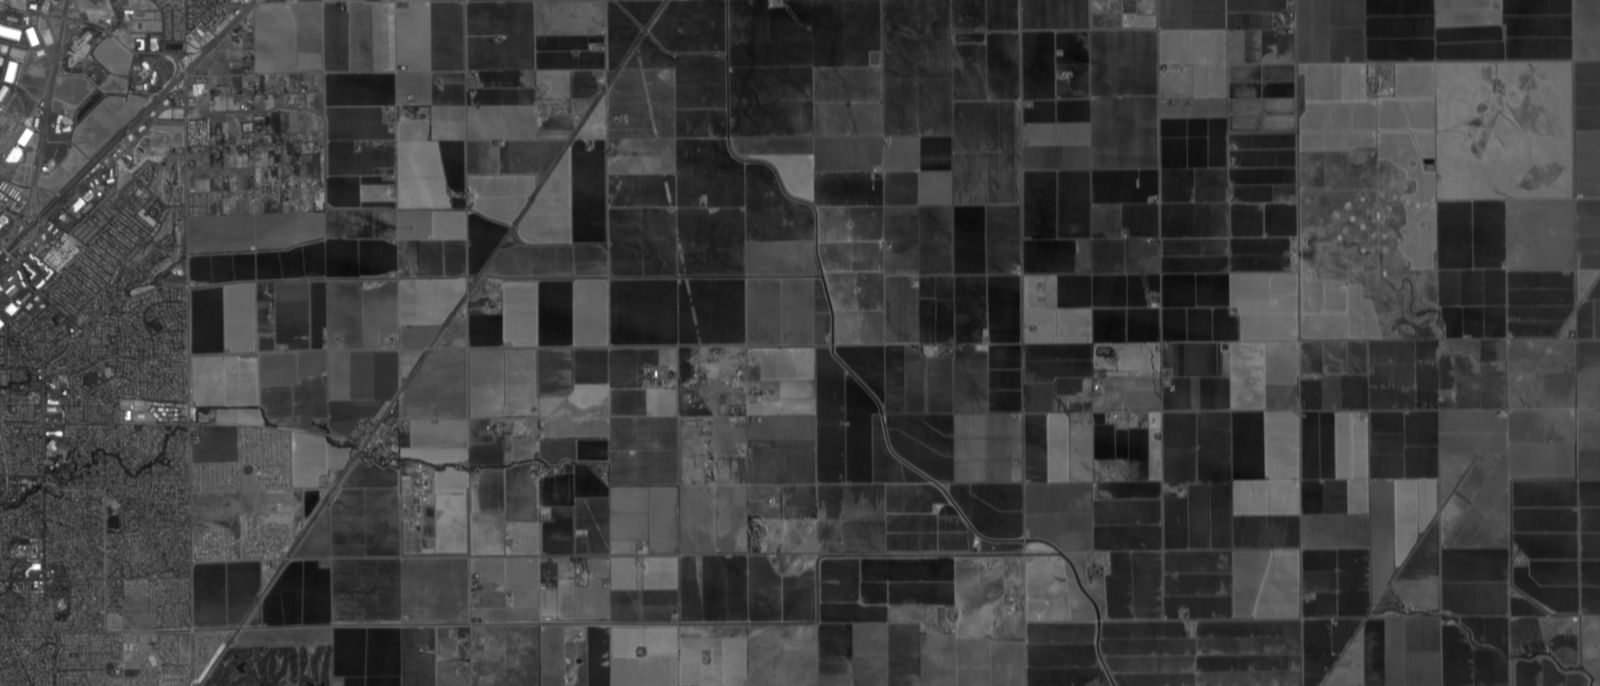
One scene, 31 bands. Growing crops turn from dark to bright across the red edge, 700–750 nm.
- Growing crop
- Drying field
- Bare soil
- Water
- Band
- Centre
- Width
31 bands · 445–869 nm · 5.2 m
Combinations
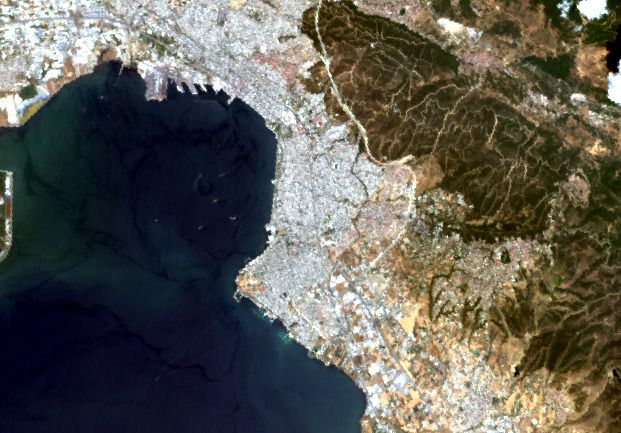
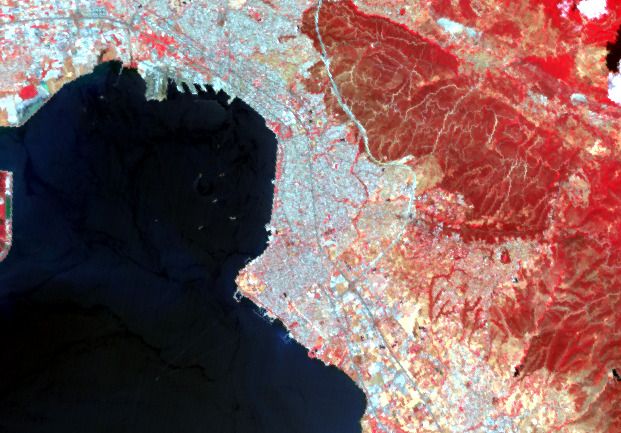
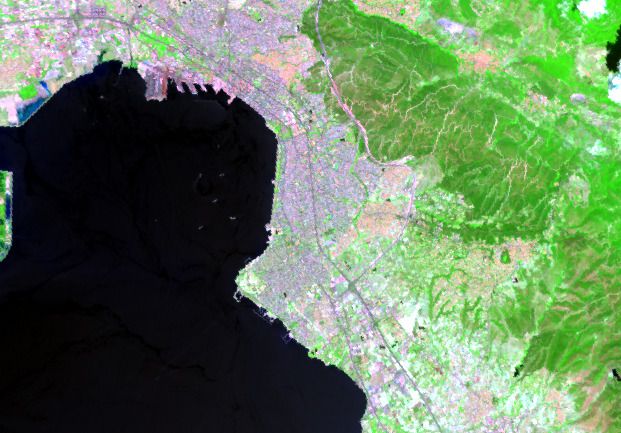
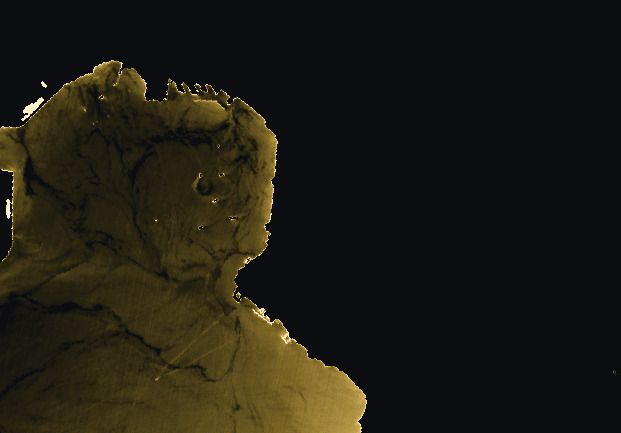
One scene, 426 bands at 30 m: three composites and five indices.
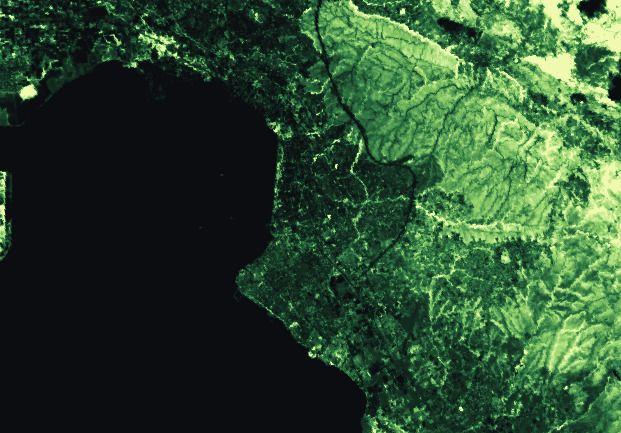
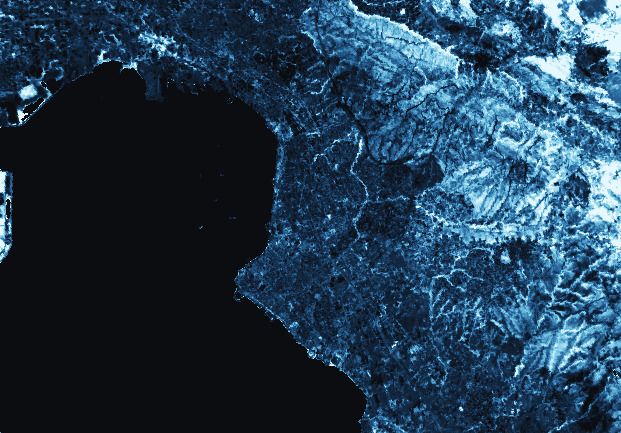
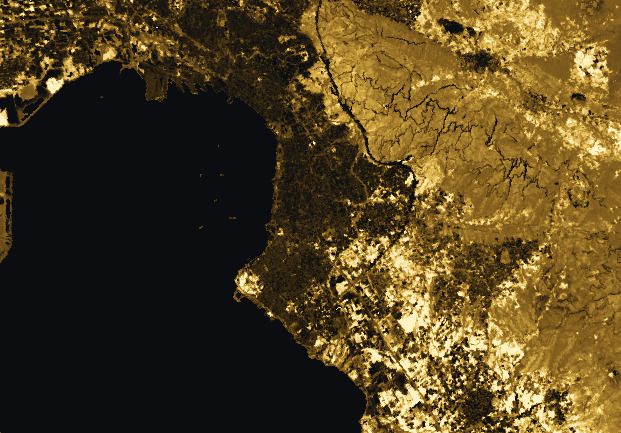
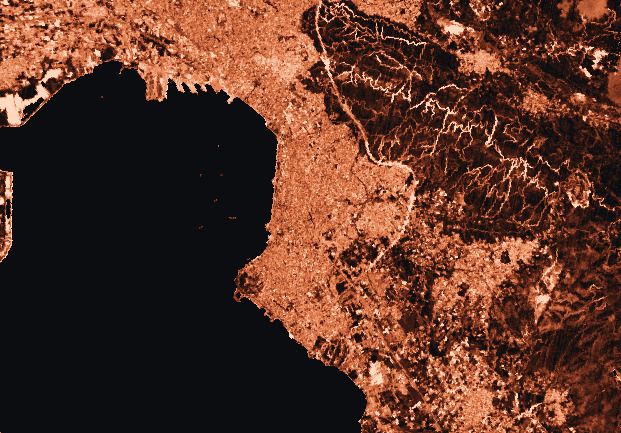
Composites
Indices
LowHigh
426 bands · 376–2499 nm · 30 m
Sampling
Bands across the spectrum, multispectral against hyperspectral.
WorldView-3Vantor · 16 bands
DragonetteWyvern · 31 bands
FirefliesPixxel · 135+ bands
TanagerPlanet · ≈426 bands
4006008001000140018002200
Fireflies and Tanager drawn at their published band count, evenly spaced.
Gallery
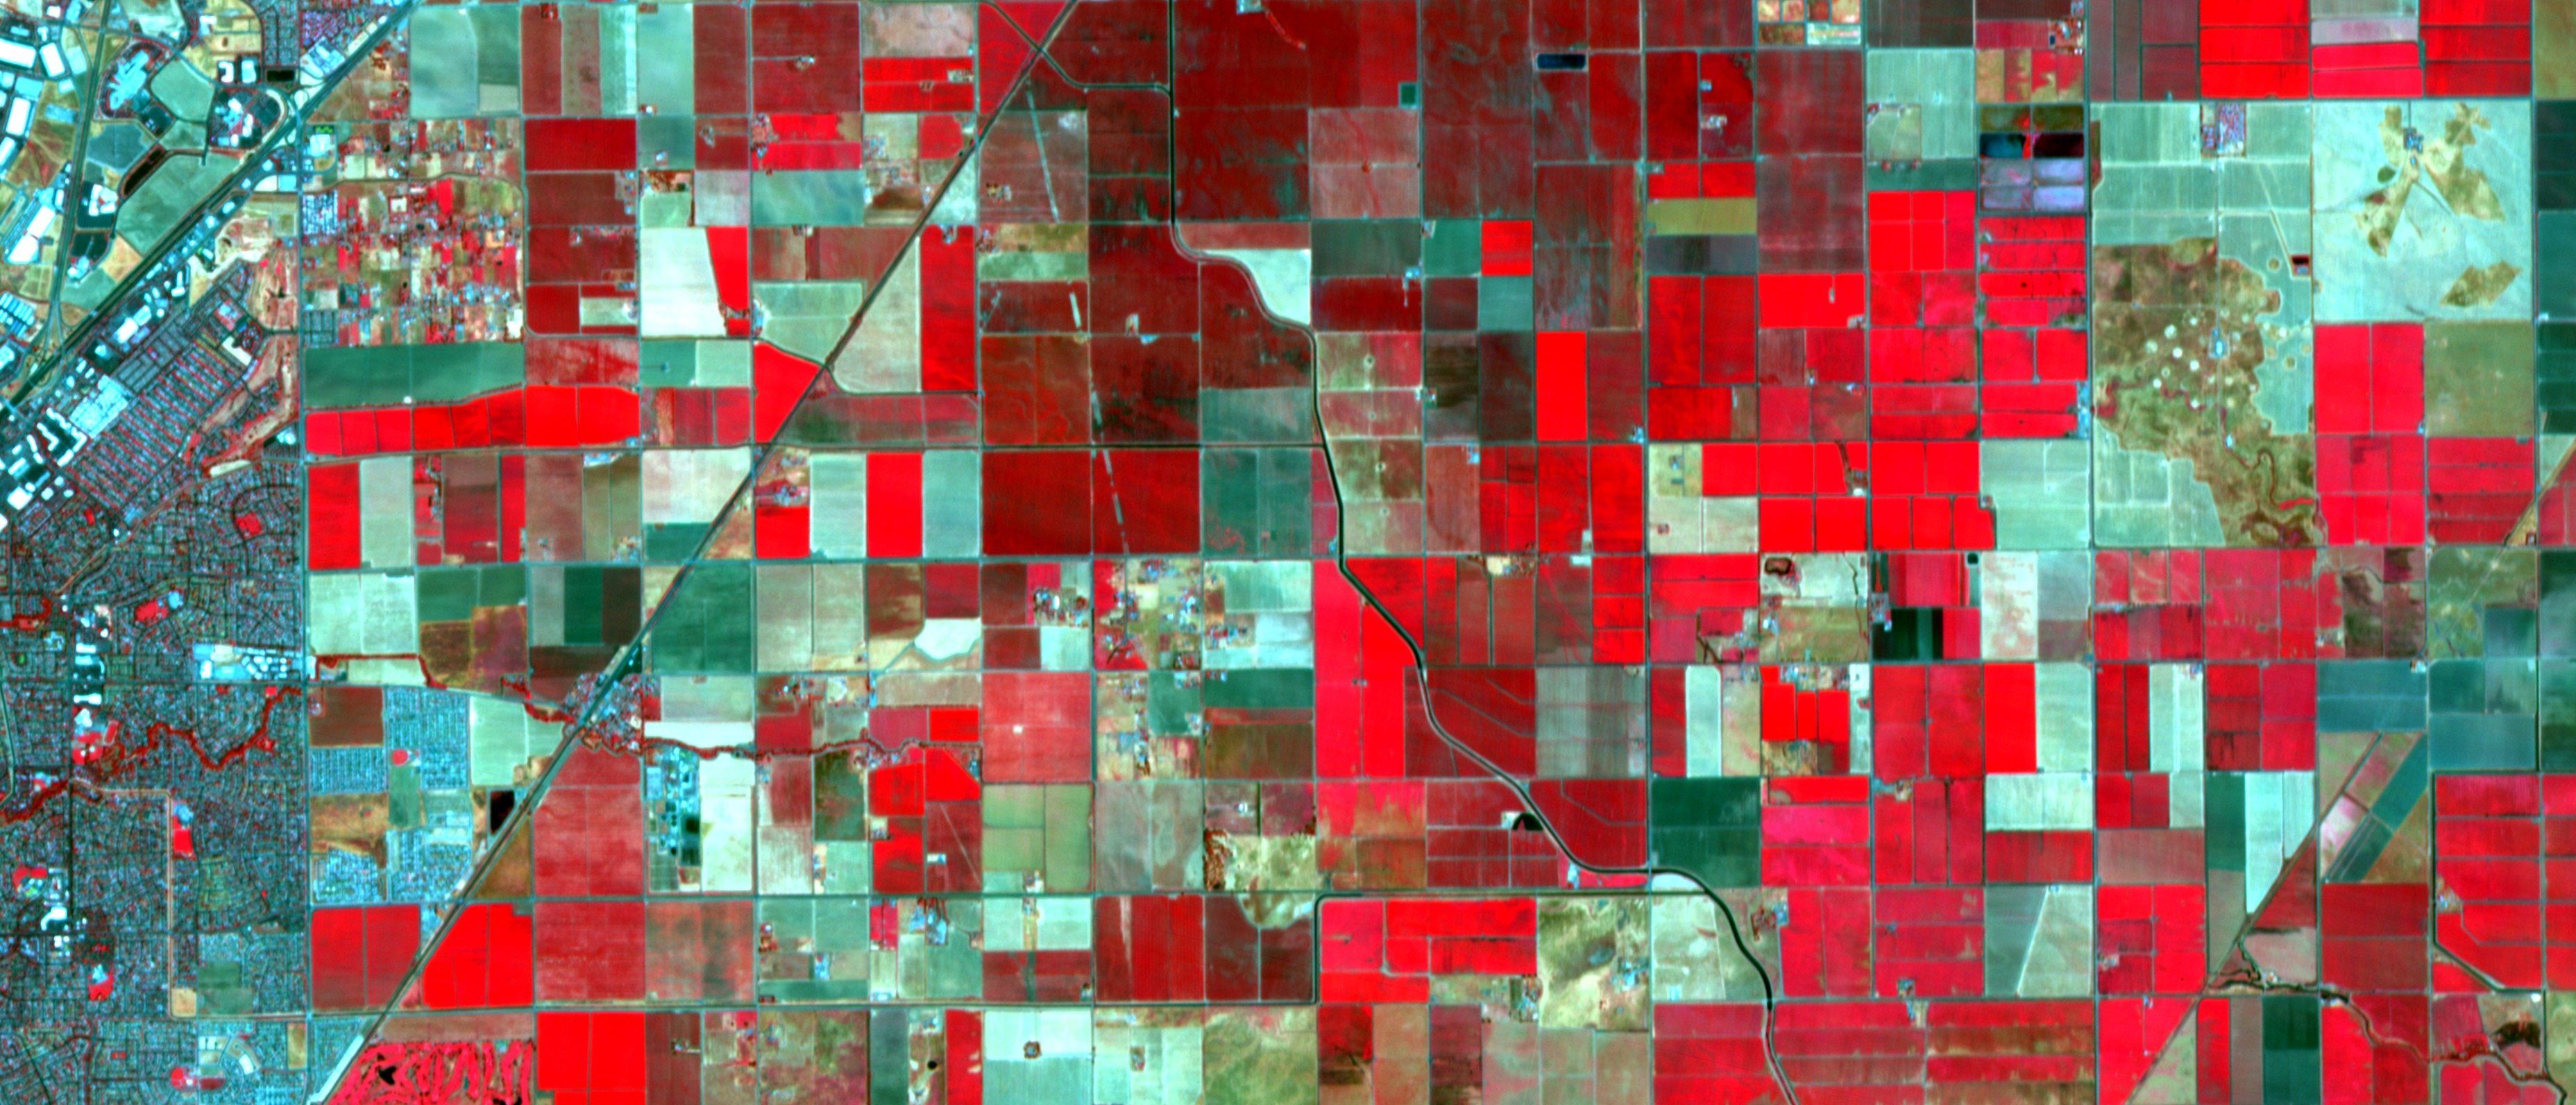
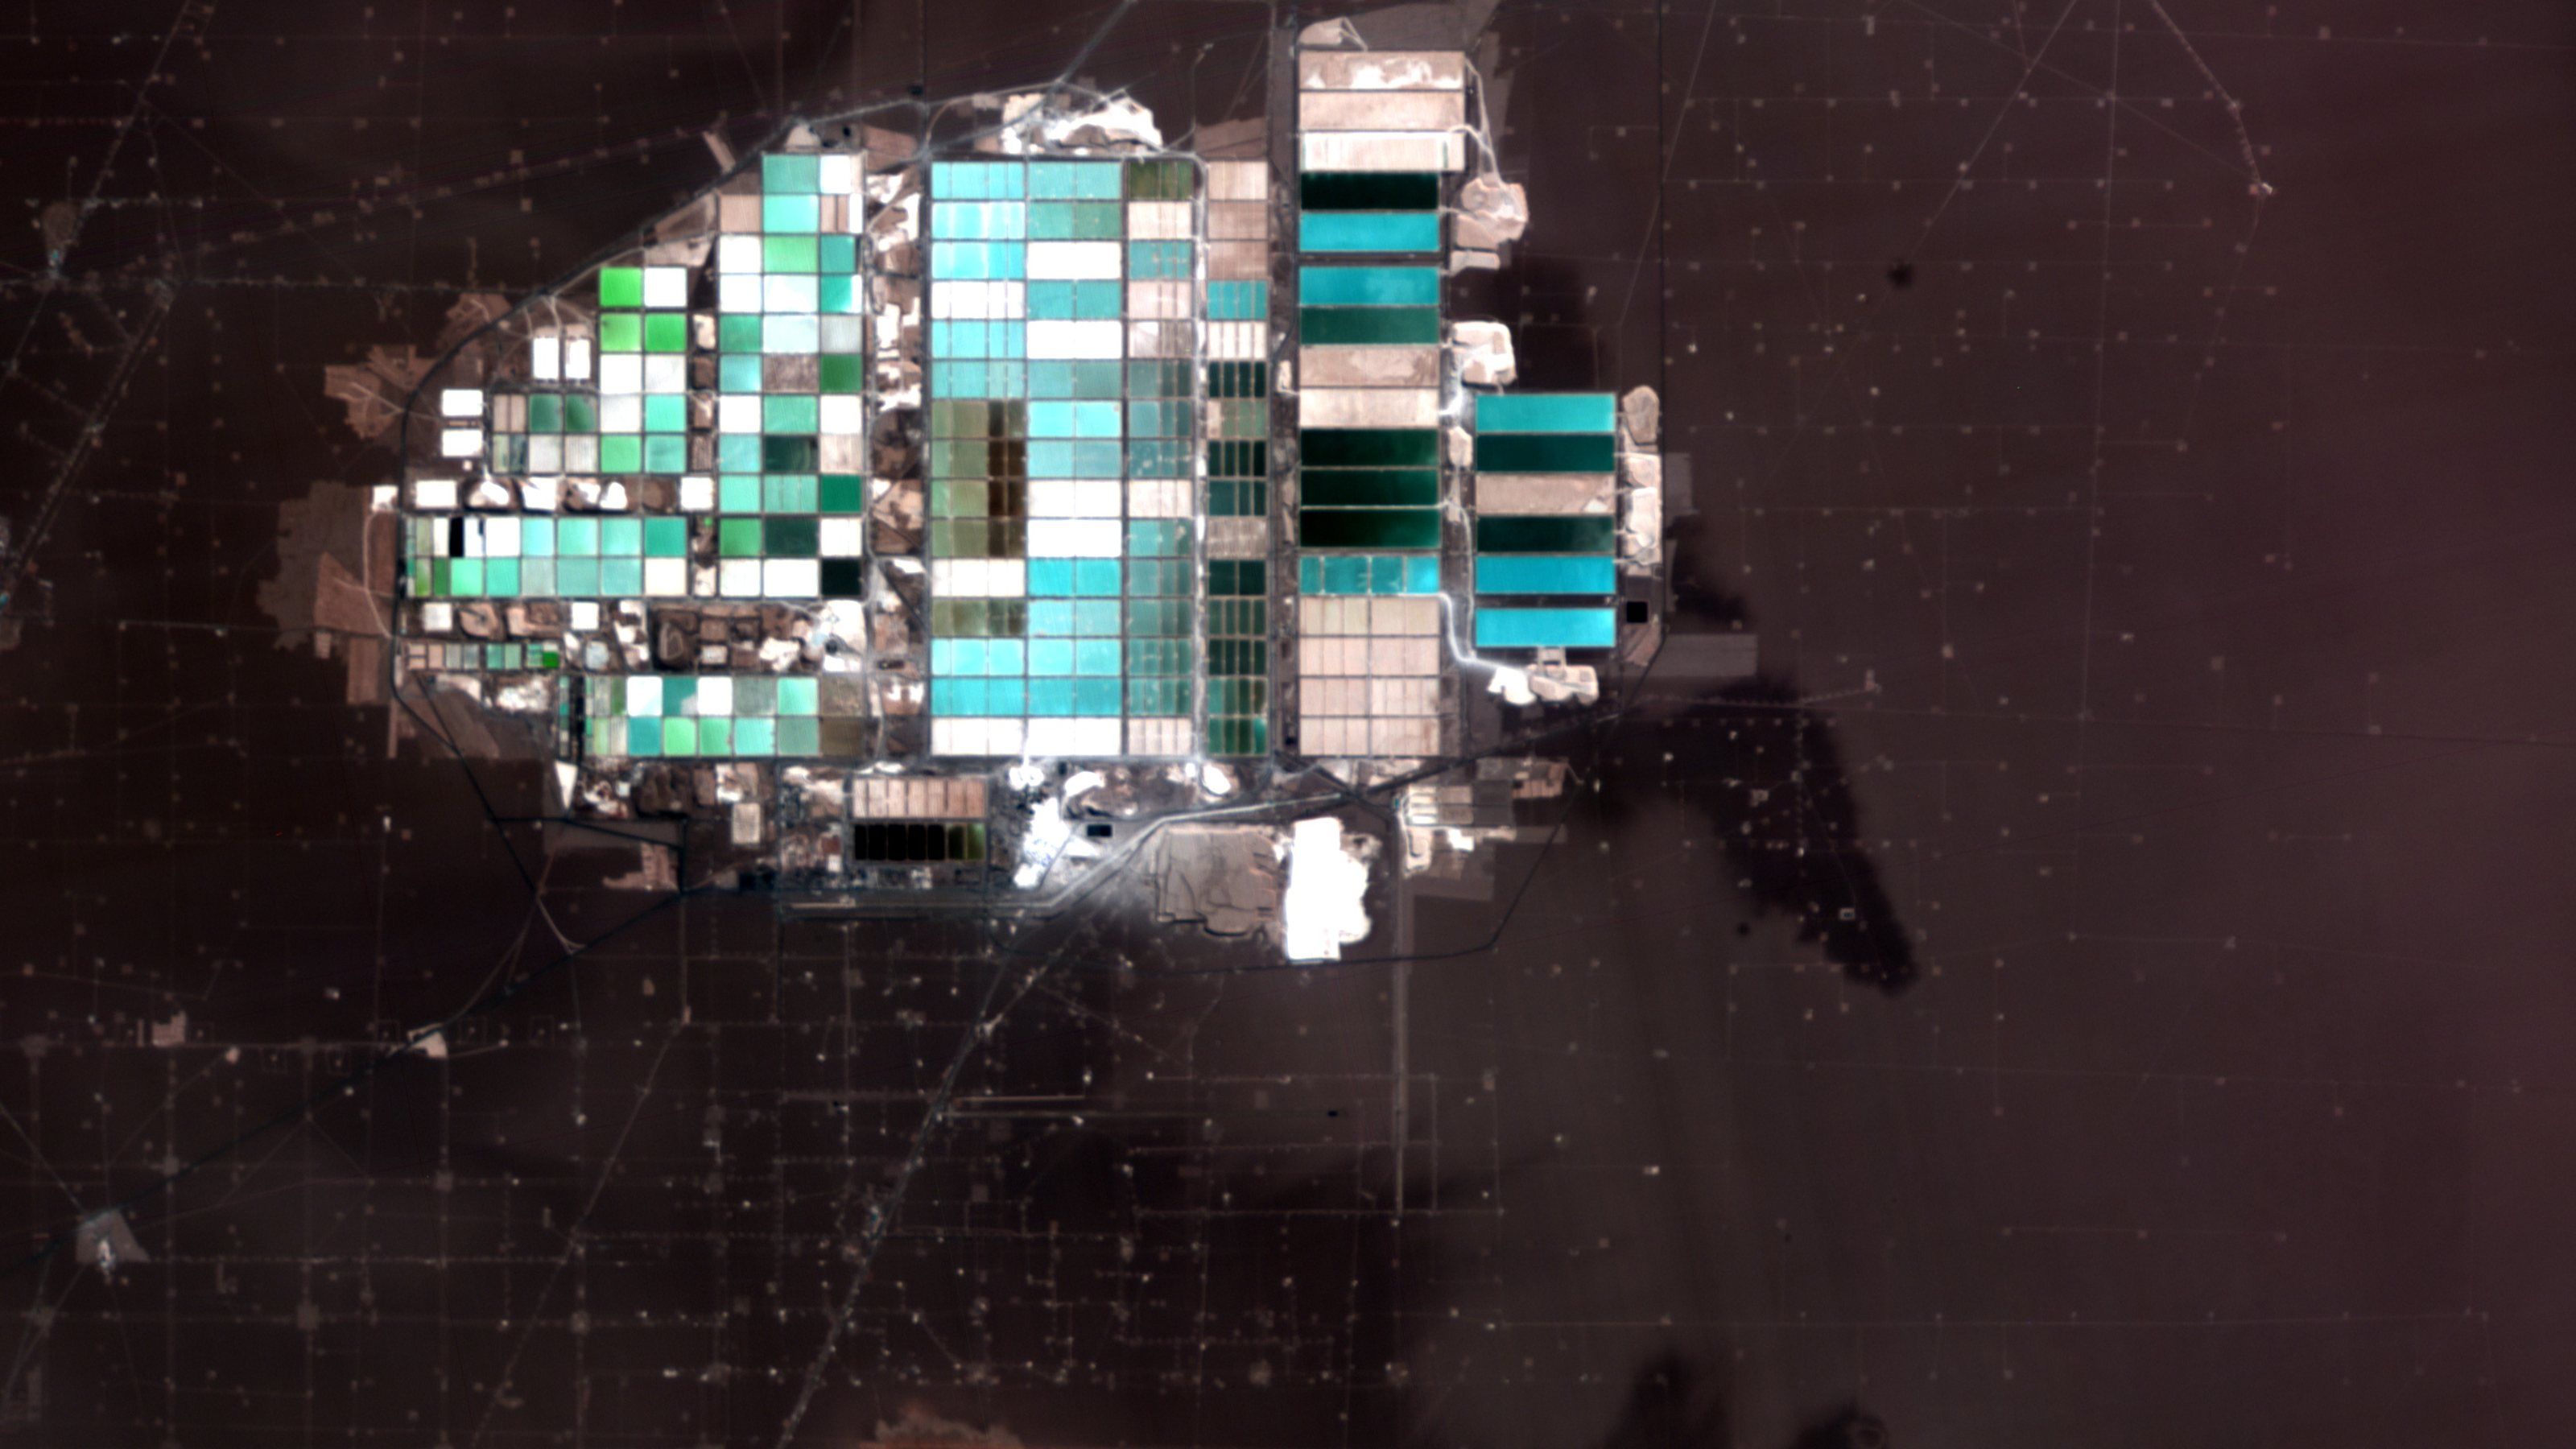
Select a frame to open it at full resolution.
Detects
- Crop species and variety, not just “vegetation”
- Mineral composition of exposed ground
- Water quality: chlorophyll, sediment, algal blooms
- Plastics, hydrocarbons and other materials by their spectral signature